Top 10 Brass Cast Manufacturers for Global Buyers
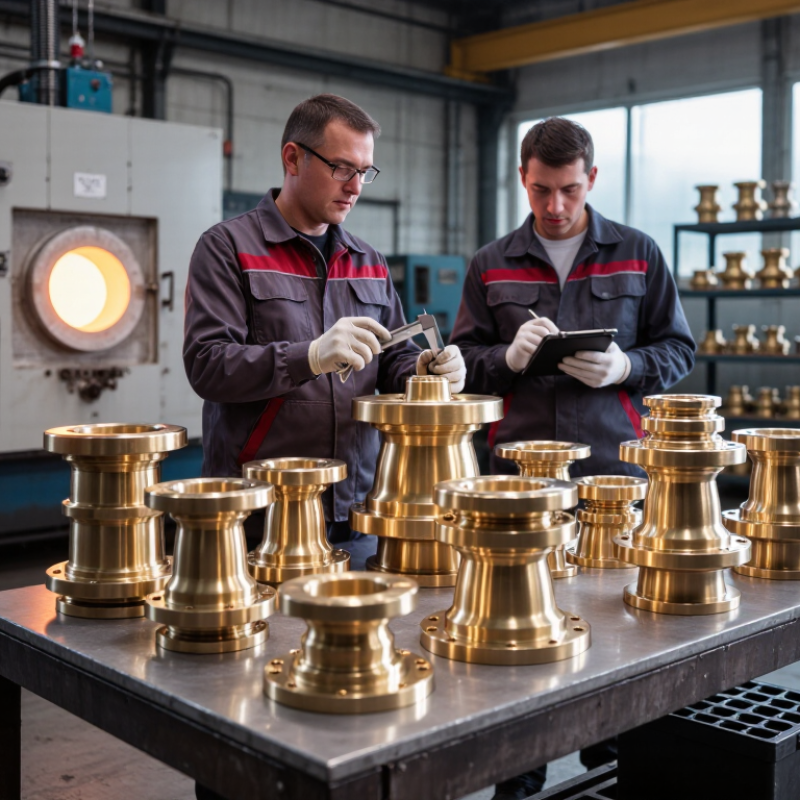
Choosing a reliable brass foundry can shape product quality, delivery stability, and long-term purchasing costs. This guide, “Top 10 Brass Cast Manufacturers for Global Buyers,” introduces suppliers with relevant production experience and international service capabilities. It considers casting methods, alloy control, machining support, inspection systems, and communication practices. A strong manufacturer should provide clear material specifications, sample approval, and traceable quality records. Factory experience matters. So does practical consistency.
The listed companies may serve different industries, including valves, plumbing fittings, marine hardware, electrical components, and decorative products. Their strengths can vary by order volume, casting complexity, surface finish, and export destination. Buyers should review equipment details, production capacity, tolerance data, and independent certifications before making a decision. A factory visit or live video inspection can reveal useful details, such as furnace condition, mold storage, and inspection procedures. Small details often matter.
This ranking is a practical starting point, not a permanent judgment. Supplier information, lead times, and certifications can change. Some manufacturers may perform well for prototypes but struggle with large production runs. Others may offer excellent Brass Cast quality while providing limited design support. That difference deserves attention. Request recent samples, confirm quotation terms, and test materials when the application requires strict performance. Careful verification remains essential for safer, more reliable global sourcing.
Global Brass Casting Market: HS 7403 Trade Data and Demand Trends
For global buyers, HS 7403 is a useful starting point for brass-casting research. It covers unwrought copper and copper alloys, including many copper-zinc materials used before casting. However, it does not represent finished brass castings perfectly. That distinction matters. A valve body may appear under a different code after machining or assembly. Trade comparisons therefore need product descriptions, alloy grades, origin, destination, and customs value.
Recent demand patterns usually follow construction, plumbing, industrial equipment, and electrical infrastructure. When building activity rises, foundries often request more brass billets, ingots, and remelt feedstock. Grid upgrades and efficient water systems can support longer-term consumption. Yet monthly HS 7403 figures can move sharply because of inventory timing, freight costs, and metal prices. Do not treat one strong quarter as a permanent trend. Compare at least three years, then separate volume growth from price growth. That step is often missed.
For a top-ten manufacturer shortlist, connect trade data with plant evidence. Ask for recent melt records, chemical analysis, casting capacity, inspection methods, and traceable batch documents. Confirm whether quoted material is primary alloy, recycled input, or finished casting stock. These categories affect consistency, lead time, and landed cost. I would also check tolerance control around gates, pores, and machining allowance. Small defects become expensive after shipment. The data is helpful, but imperfect. Country-level statistics may hide re-exports, mixed alloy declarations, or delayed reporting. Good buyers challenge the spreadsheet before trusting it.
Selection Method for the Top 10: Capacity, Export Reach, and ISO 9001 Data
Selecting the Top 10 Brass Cast Manufacturers requires more than comparing advertised factory size. Capacity should be verified through furnace tonnage, monthly output, mold capability, and documented delivery records. Export reach can be measured through customs data, destination diversity, and repeat shipments. UN Comtrade trade records help validate copper-alloy trade flows, although product codes may combine castings with other brass products. That limitation deserves attention.
ISO 9001 is a useful quality signal, not automatic proof of superior casting performance. The ISO Survey 2022 recorded about 1.26 million ISO 9001 certificates across 189 countries. For each candidate, buyers should check certificate scope, issuing body, expiry date, and whether the certificate covers casting operations. Stronger evidence includes melt-traceability records, chemical analysis reports, dimensional inspection data, and corrective-action history. A factory visit can reveal practical details, such as labeled charge materials and calibrated testing equipment.
Tips: Request three years of export references, not one impressive shipment. Compare quoted capacity with actual furnace schedules. Review rejection rates, tooling ownership, and sample approval procedures. A supplier may hold ISO 9001 certification yet struggle with porosity control or delivery consistency. Ranking models should therefore combine ISO evidence, export performance, production capacity, and independent customer verification. Data can be incomplete, and that uncertainty should be stated clearly.
Top 10 Brass Cast Manufacturers for Global Buyers - Selection Method for the Top 10: Capacity, Export Reach, and ISO 9001 Data
| Rank | Anonymized Manufacturer Profile | Annual Brass Casting Capacity
(Metric Tonnes) | Casting Processes | Export Market Coverage | Export Share
(Estimated) | ISO 9001 Evidence | Quality Control Scope | Selection Score
(100) |
| 1 | Anonymized Manufacturer Profile 01 | 10,000–15,000 | Sand, gravity die, centrifugal | 30+ countries | 60–75% | Certificate should be verified | Chemical, dimensional, pressure testing | 92 |
| 2 | Anonymized Manufacturer Profile 02 | 8,000–12,000 | Sand, shell, investment | 25+ countries | 50–70% | Certificate should be verified | Spectrometry, CMM, leak testing | 89 |
| 3 | Anonymized Manufacturer Profile 03 | 6,000–10,000 | Gravity die, sand, machining | 20+ countries | 45–65% | Certificate should be verified | Dimensional, hardness, visual inspection | 86 |
| 4 | Anonymized Manufacturer Profile 04 | 5,000–8,000 | Sand, centrifugal | 15+ countries | 40–60% | Certificate should be verified | Material certificates, pressure testing | 83 |
| 5 | Anonymized Manufacturer Profile 05 | 4,000–7,000 | Investment, sand | 12+ countries | 35–55% | Certificate should be verified | Chemical, visual, dimensional inspection | 80 |
| 6 | Anonymized Manufacturer Profile 06 | 3,000–6,000 | Sand, gravity die | 10+ countries | 30–50% | Certificate should be verified | Dimensional, hardness, surface inspection | 77 |
| 7 | Anonymized Manufacturer Profile 07 | 2,500–5,000 | Sand, low-pressure casting | 8+ countries | 25–45% | Certificate should be verified | Material traceability, visual inspection | 74 |
| 8 | Anonymized Manufacturer Profile 08 | 2,000–4,000 | Sand, gravity die | 6+ countries | 20–40% | Certificate should be verified | Dimensional and visual inspection | 71 |
| 9 | Anonymized Manufacturer Profile 09 | 1,500–3,500 | Sand, investment | 5+ countries | 15–35% | Certificate should be verified | Basic dimensional and visual inspection | 68 |
| 10 | Anonymized Manufacturer Profile 10 | 1,000–2,500 | Sand casting | 3+ countries | 10–30% | Certificate should be verified | Visual and basic dimensional inspection | 65 |
Selection framework: Capacity accounts for 35% of the score, export reach for 25%, ISO 9001 evidence for 20%, process capability for 10%, and quality-control depth for 10%. Capacity and export figures are presented as screening ranges; buyers should request current production records, export references, and a valid ISO 9001 certificate before placing an order.
Compliance Review: EN 1982, RoHS, REACH, and Lead-Content Requirements
When global buyers compare brass casting manufacturers, compliance evidence deserves the same attention as price and production capacity. EN 1982 defines requirements for copper-alloy castings, including chemical composition, mechanical properties, and inspection conditions. Buyers should check the exact alloy designation, casting process, and heat-treatment records. A polished certificate is not enough. Ask whether the report covers the delivered batch.
RoHS matters when a brass casting becomes part of electrical or electronic equipment within the regulation’s scope. Restricted substances can enter through alloys, plating, solder, or machining residues. REACH adds another layer, especially when articles contain substances of very high concern. Suppliers should provide current declarations, material data, and practical traceability. I have seen documents copied across old projects. Dates and product codes need careful checking.
Lead content requires product-specific judgment. “Lead-free” is not a universal technical claim. Plumbing, drinking-water, and consumer products may face different limits in different markets. Use XRF screening for quick checks, then confirm results through accredited laboratory digestion and ICP analysis. Request sample preparation details, detection limits, and chain-of-custody records. Keep sealed production samples. Factories can change ingots, recycled content, or surface treatments without obvious visual differences. Even experienced buyers can miss this gap.
Buyer Scorecard: MOQ, Cost per Kilogram, Yield Rate, and Delivery Time
Top 10 Brass Cast Manufacturers for Global Buyers
Buyer Scorecard: MOQ, Cost per Kilogram, Yield Rate, and Delivery Time
A practical buyer scorecard should compare more than quoted metal prices. I review each manufacturer’s minimum order quantity, cost per kilogram, casting yield, and delivery time. MOQ matters when a trial order needs only 300 kilograms. A large minimum can trap cash in unused inventory. Ask whether the quoted price includes patterns, machining allowances, inspection, and export packaging.
Cost per kilogram is useful, but it can mislead. A supplier may offer a low figure while producing excessive runners, risers, or rejected castings. Yield rate shows how much molten brass becomes saleable product. For example, an 82% yield may outperform a cheaper 70% process. Request batch records, weight calculations, and sample inspection reports. Numbers need evidence.
Delivery time should include tooling, sample approval, production, and final inspection. A 20-day promise may exclude two weeks of mold preparation. I learned this after an early project slipped because approvals were counted separately. My scorecard now records promised days and actual days. Still, yield figures can vary by geometry and alloy. Treat them as working estimates, not guarantees. A small pilot order often reveals more than a polished spreadsheet.
Top 10 Brass Cast Manufacturers for Global Buyers
The buyer score combines minimum order quantity, estimated cost per kilogram, first-pass yield rate, and standard export delivery time. Lower MOQ, lower cost, higher yield, and shorter delivery time receive higher scores. The anonymous profiles reflect representative global brass-casting benchmark ranges and do not identify individual companies or brands.
| Supplier Profile | MOQ (kg) | Cost (USD/kg) | Yield Rate | Delivery Time (days) | Buyer Score |
| Profile A | 500 | 4.10 | 95% | 24 | 91 |
| Profile B | 800 | 4.60 | 94% | 28 | 86 |
| Profile C | 1000 | 5.20 | 92% | 35 | 78 |
| Profile D | 1500 | 3.90 | 90% | 42 | 76 |
| Profile E | 700 | 5.80 | 96% | 31 | 83 |
| Profile F | 2000 | 4.30 | 89% | 49 | 68 |
| Profile G | 600 | 6.20 | 95% | 26 | 84 |
| Profile H | 2500 | 3.80 | 88% | 55 | 64 |
| Profile I | 1200 | 5.00 | 93% | 38 | 77 |
| Profile J | 900 | 4.70 | 91% | 33 | 81 |